
2013
“Breaking Bad” ended, “Thrift Shop” by Macklemore was the #1 song of the year and “Iron Man 3” was the top grossing movie.
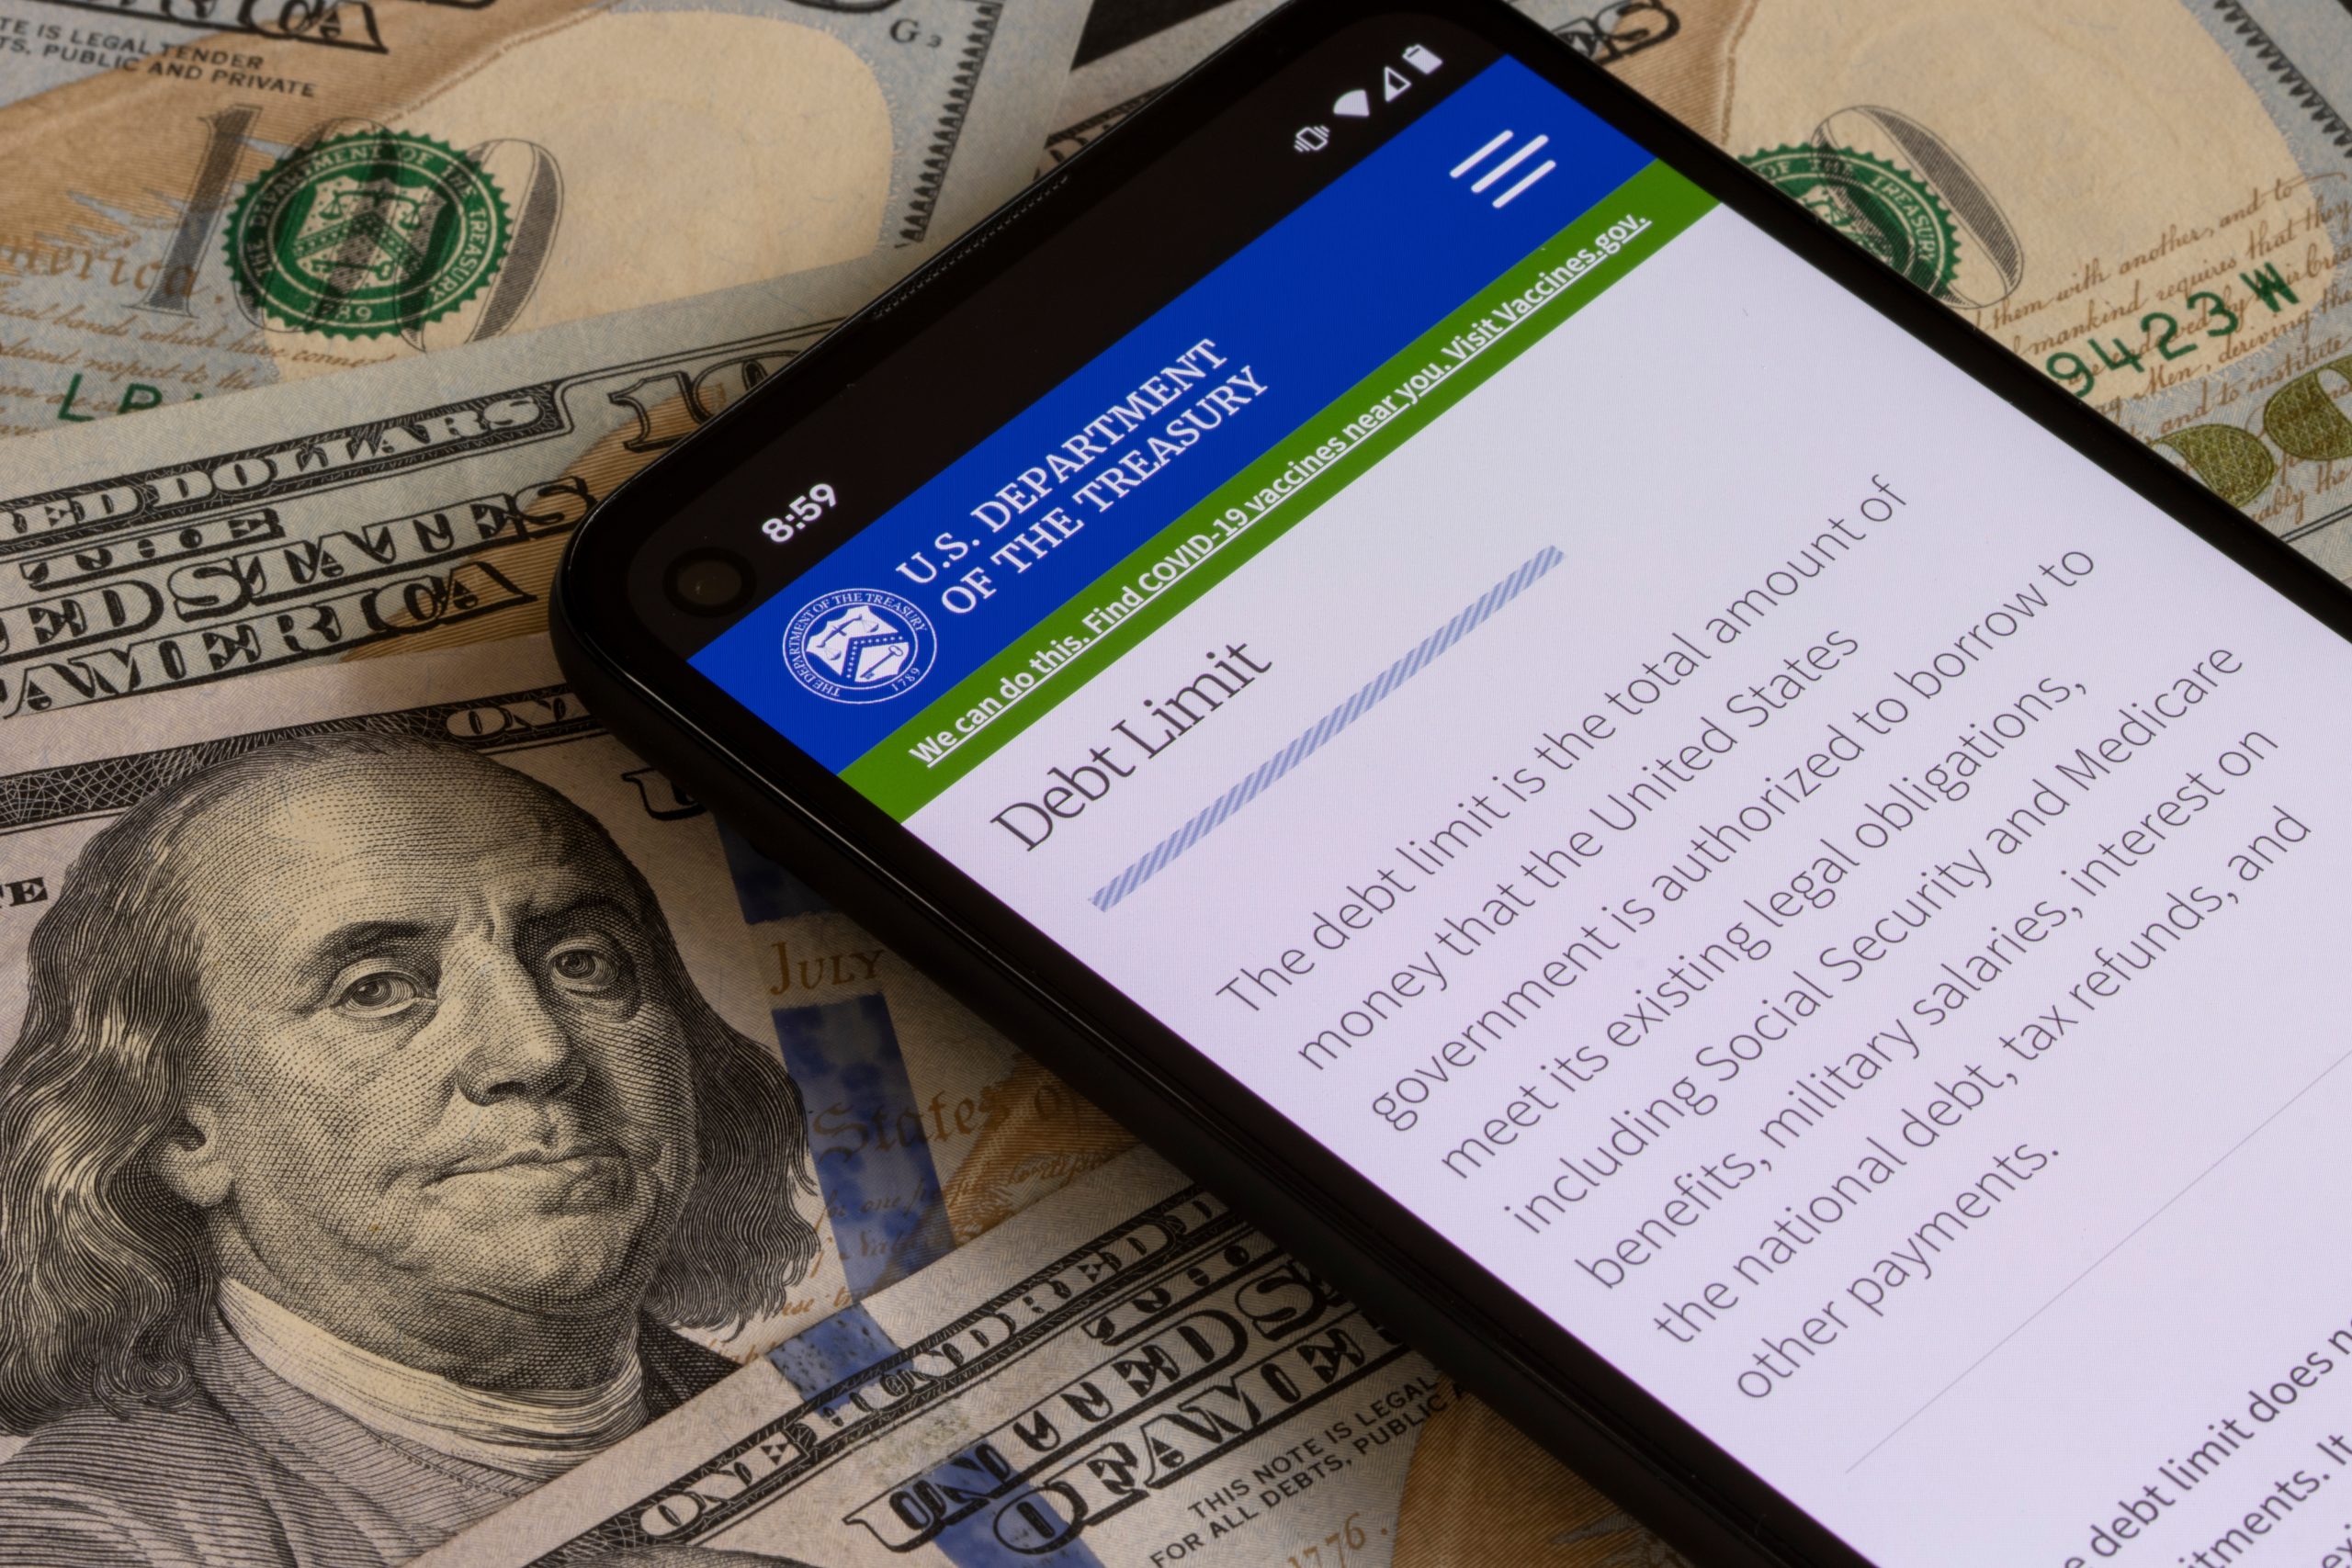
Like this year, in 2013 the debt-ceiling crisis began in January when the U.S. reached its debt ceiling limit. Republicans opposed raising it unless Obamacare was defunded. Obama didn’t want to do that. The Treasury Department then, as now, implemented extraordinary measures to enable the financing of the government to continue. On January 15th, Fitch warned that delays in raising the debt ceiling could result in a formal review of the U.S.’s credit rating, possibly leading it to being downgraded from AAA.
This went on and on until October, when the government went into partial shutdown from October 1st through October 16th, when Republicans, who were mostly blamed for this, passed a continuing resolution to fund the government and, long story short, that was the end of that.
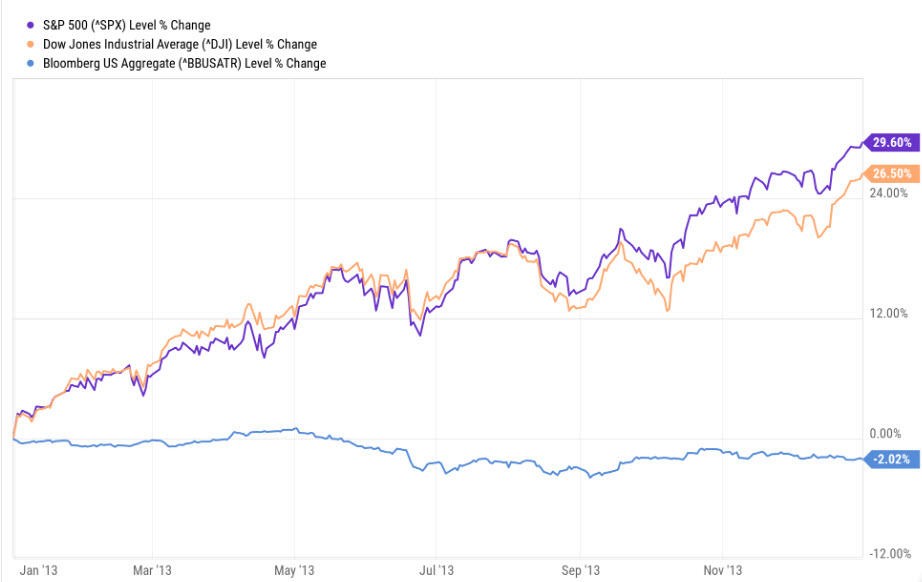
The chart below shows how the market performed during all of this in 2013. The S&P 500 soared 29% and bonds declined 2%. The bond decline had little to nothing to do with the debt ceiling. That was the year of the “taper tantrum” when bonds sold off on the unexpected announcement that the Fed would be slowing its bond purchases. In an echo of history, through 1/24/13 the S&P was up 4.8% year-to-date. Through 1/24/23 the S&P was up 4.3% year-to-date.
2011
Charlie Sheen was “winning,” Adele’s “Rolling in the Deep” topped the charts, and the last “Harry Potter” movie raked in the most at the theaters.
There was another debt ceiling crisis in 2011 that caused a bit more volatility. In that year, Republicans tied raising the debt ceiling to Obama implementing spending cuts. The ceiling was reached in May, with the Treasury implementing extraordinary procedures. An agreement was reached and signed into law on August 2nd.
Despite this, on Friday August 5th, S&P cut the U.S.’s credit rating from AAA to AA+, the first-ever downgrade for the U.S. Moody’s and Fitch kept the U.S. at AAA. Monday August 8th was a pretty bad day on the stock market, with the S&P falling 6.7%. The Aggregate Bond Index held up fine on the flight to safety, rising 0.4%. So, there was a reaction in the market this time, but it was to the rating cut and it was extremely short-lived. It took the S&P 500 a couple weeks to recover from that day, but it finished the year flat. The Agg rose 7.8% in 2011. Here’s the chart:
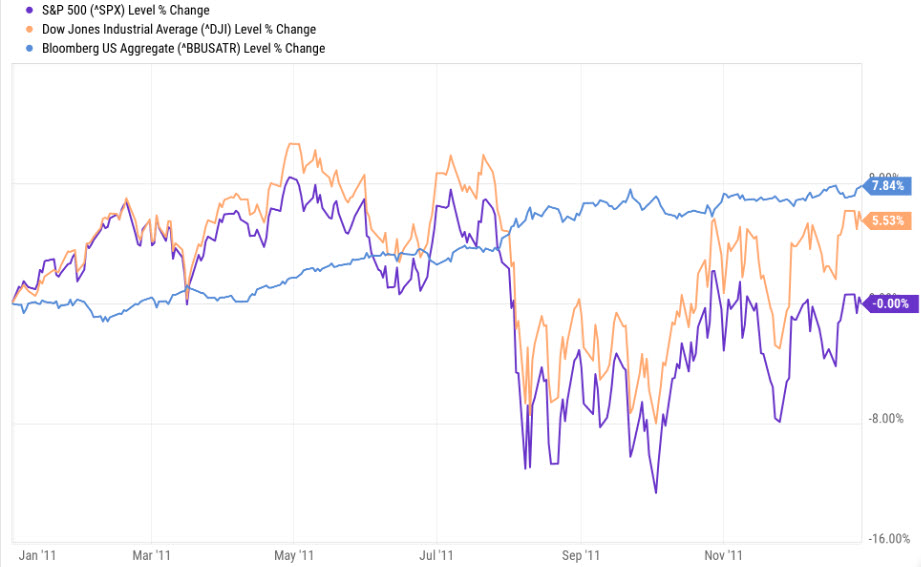
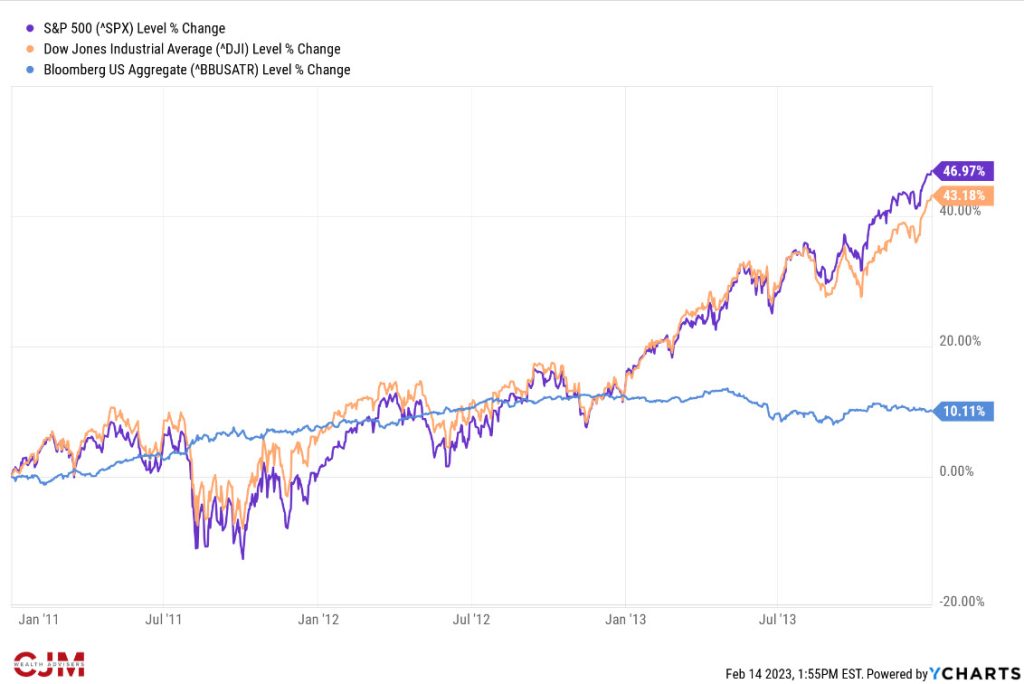
The chart above looks ugly, but the short-term volatility doesn’t look bad in the slightly longer term. Here’s the chart for 2011-2013 showing the August selloff as just a dip in the road to solid gains:
The economy is incredibly complex and is not impacted long-term by political squabbles. Companies continue trying to make money and people continue to go about their lives and consume goods and services. Past performance is not a guarantee for future performance, and we continue to believe in staying invested with an appropriately diversified portfolio for the long-term.
Social Media