
A noticeable feature of the stock market this year has been the big difference in the performance of the two major stock indexes. Through September 14, 2023 the S&P 500 has raced ahead with a gain of 17%, while the Dow Jones Industrial Average trails far behind with a gain of only 5%. The S&P is well ahead of most major international equity and bond indexes as well.
The S&P is more heavily weighted toward the big technology-related stocks (Apple, NVIDIA, Google, Amazon) that have outperformed this year with the emergence of artificial intelligence as a major theme, but there have been industry-changing developments throughout the market’s history. It’s worth taking a look at the past history of the two indexes to see if this level of outperformance is sustainable.
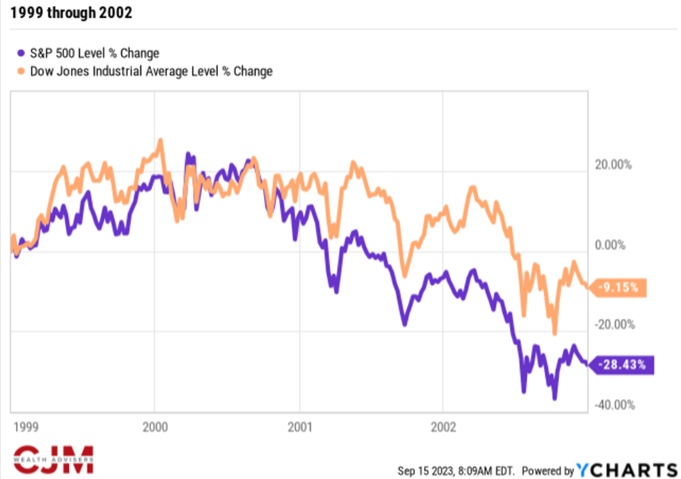
This year’s 12-percentage point outperformance by the S&P over the Dow is historically wide. Looking back to 1990, the biggest gap in performance for a full year was in 1998 when the S&P jumped 27% during the early dot-com days while the Dow rose 16%, a gap of 11 percentage points. What happened after that is a good argument against chasing returns. The Dow beat the S&P in each of the next four years (one positive year and three negative) as the dot-com boom turned to bust, 9/11 happened and the U.S. suffered through a recession. The Dow lost 9% from 1999 through 2022, while the S&P plunged 28%.
Looking at each year from 1990 through 2022, a remarkably equal record of performance reveals itself. Over those 23 years, the S&P beat the Dow in 16 years, while the Dow came out on top in 15 years. Two years were a virtual tie between the two. This chart illustrates how close the performance of the two indexes have been from 1990 through now.
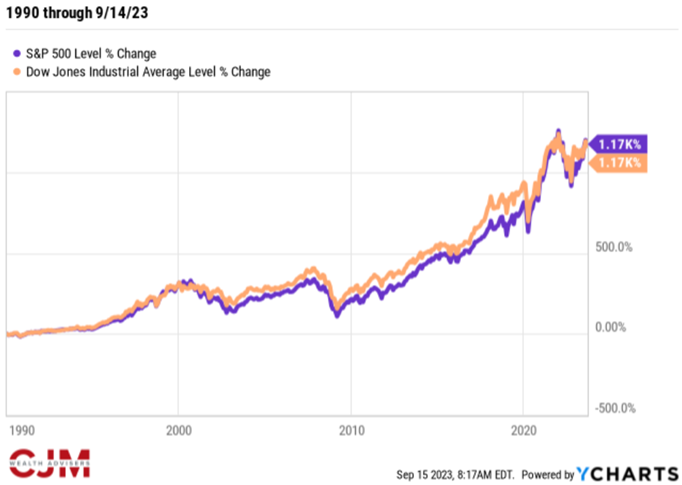
The performance of the indexes since 1990 has been virtually identical with both gaining 1,170%. This is astonishing. There is a slight difference due to rounding, so if you invested $100,000 in the S&P at the start of 1990 you would have $1,275,000 today, while your friend who invested the same amount in the Dow would have $1,268,000. You could boast that you’re $7,000 richer after more than 33 years, but you would never be that petty.
You don’t have to go back 30 years to see how time affects returns. Just going back to the beginning of last year shows a dramatically different picture of the recent returns of the S&P and the Dow. Although the S&P is way ahead this year, it trailed the Dow significantly in 2022 when it dropped 19% compared with a 9% decline in the Dow. When you look at the performance of the two indexes since the start of 2022, a different picture emerges.
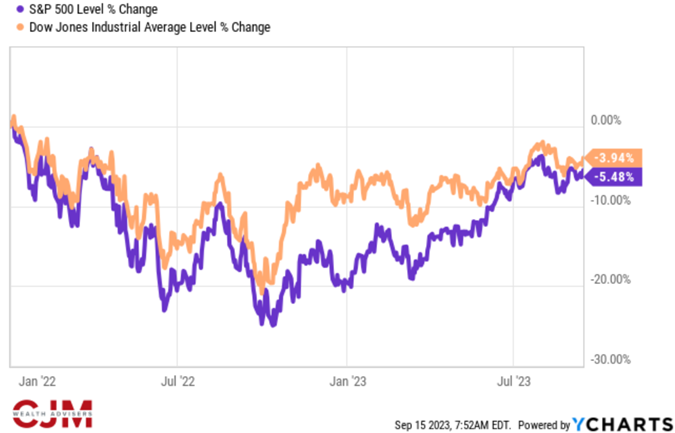
The Dow is actually ahead of the S&P with a loss of about 4% compared with a 5.5% decline in the S&P since the start of last year. This shows how merely changing the start date when looking at performance can change the numbers entirely. It also illustrates the importance of limiting losses when the market declines, because you don’t have to outperform on the upside to come out ahead.
Fear of missing out during a year when the market is rising is natural, but investing happens over a long period of time. The year-by-year fluctuation of the market means that what works one year may not work the next and you’re not going to get it exactly right every time. None of us felt good last year when everything was negative, but limiting the loss in a down year helps you come out ahead even if you aren’t 100% invested in the best performing asset class when markets are rising. Whether you picked the S&P 500 or the Dow over the past 3-plus decades hasn’t been important. Staying invested is what puts you ahead in the long run.
Social Media